Your health, scored in 60 seconds.
Download Free Scan App.
It is 100% FREE forever
Apple or Android
Your scans surface 198 biomarkers across twelve areas of your health, and connected wearables and health apps push your total past 300. Here is what each one means, and how strong the evidence behind it is.
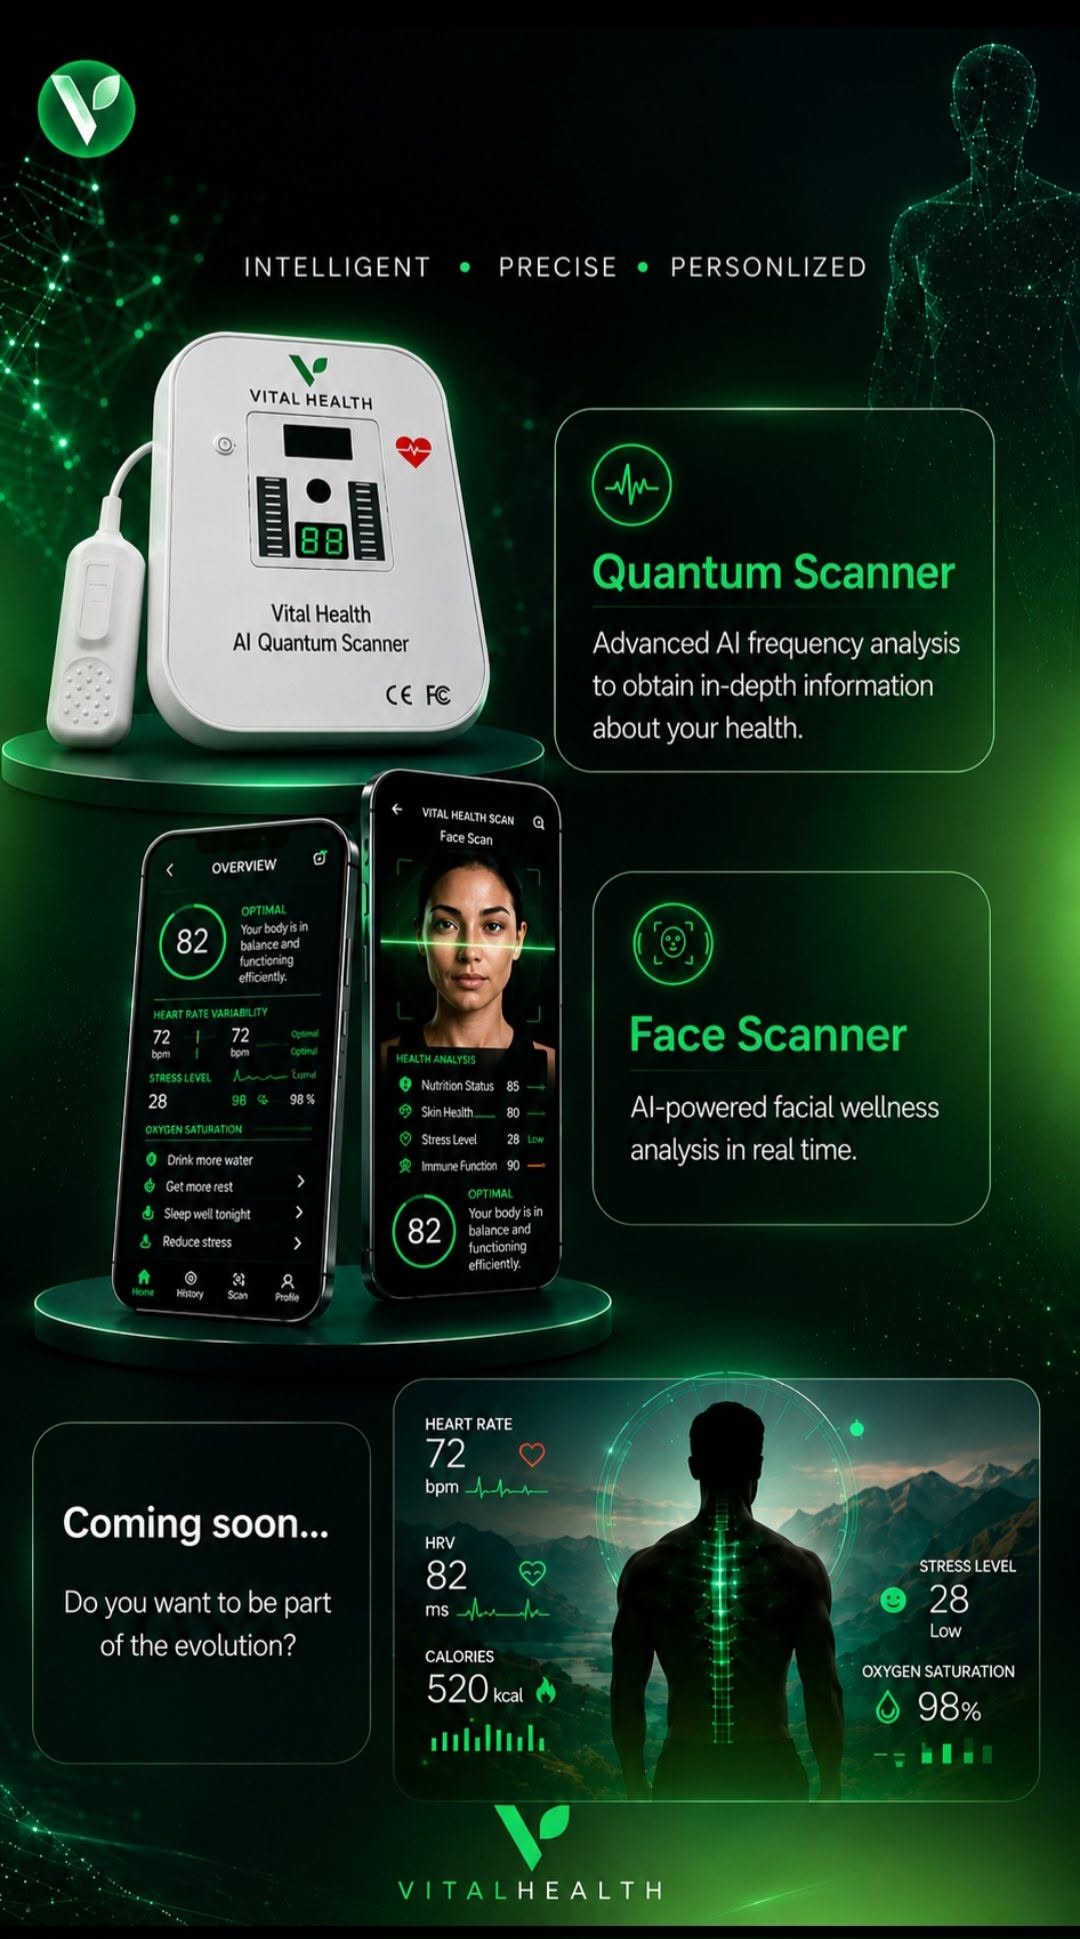
Look into your phone camera and unlock 300+ health biomarkers like heart rate, HRV and respiration, all from your phone camera in about a minute. No needle, no lab, no wearable required. Add a wearable later and every reading gets even sharper. This is proven science, now in your pocket, and you are among the first to put it to work.
 Free Scan App.
Apple or Android
Proven in the lab. Not just claimed in an ad.
Quantum Resonance Magnetic Analyzer –
A great way to see if our products are showing results for you and your family.
==============================================
Every biomarker, explained in plain English.
Your scans surface 198 biomarkers across twelve areas of your health, and connected wearables and health apps push your total past 300. Here is what each one means, and how strong the evidence behind it is.
Heart & Pulse
Your cardiac rhythm and circulation, read from the pulse in your skin.
Heart Rate (HR)
Clinically studied
Your heart rate is how many times your heart beats per minute. A normal resting heart rate is 60-100 bpm, athletes often have lower rates (40-60 bpm), which is a sign of great fitness.
Respiratory Rate (RR)
Clinically studied
Respiratory rate is how many breaths you take per minute. A healthy adult typically breathes 12-20 times per minute at rest.
Resting Heart Rate Classification
Clinically studied
Resting heart rate classification tells you where your resting heart rate falls compared to healthy ranges for your age.
Respiratory Regularity Index
Clinically studied
Respiratory regularity measures how consistent and rhythmic your breathing pattern is.
Clinical Heart Rate (Contact PPG)
Clinically studied
Clinical heart rate via fingertip PPG provides a high-accuracy reading by measuring blood flow directly through your fingertip using the phone’s camera and flash.
AFib Screening (Contact PPG)
Clinically studied
Screens your fingertip pulse for irregular rhythm that may warrant an ECG. A wellness screen, not a diagnosis.
Blood Oxygen Estimate – SpO2 (Contact PPG)
Clinically studied
Estimates blood oxygen using the phone’s flash to read your fingertip. A wellness estimate, not a medical pulse oximeter.
Palm Heart Rate (rPPG)
Clinically studied
Palm heart rate extracts your heart rate from palm blood vessels. Equal or better accuracy than face (+/- 1-3 BPM) due to dense vasculature and minimal melanin variation.
Peripheral Perfusion Index (Fingertip)
Clinically studied
Peripheral perfusion index measures the ratio of pulsatile to non-pulsatile blood flow in your fingertip. Values above 1.0 indicate good perfusion.
Blood Oxygen Estimate (SpO2)
Wellness insight
Estimates how much oxygen your red blood cells are carrying. A wellness estimate, not a medical pulse oximeter.
Systolic Blood Pressure Estimate
Wellness insight
The top number in a blood pressure reading, the force on your artery walls when your heart beats. A wellness estimate, not a validated cuff. Not a diagnosis.
Diastolic Blood Pressure Estimate
Wellness insight
The bottom number in a blood pressure reading, the pressure in your arteries between heartbeats when your heart is resting. A wellness estimate, not a validated cuff. Not a diagnosis.
Mean Arterial Pressure (MAP)
Wellness insight
Mean arterial pressure (MAP) is the average pressure in your arteries during one complete heartbeat cycle. A healthy MAP typically falls between 70 and 100 mmHg.
Pulse Pressure
Wellness insight
Pulse pressure is the difference between your systolic (top) and diastolic (bottom) blood pressure numbers. A normal pulse pressure is around 40 mmHg.
Hemoglobin Estimation
Wellness insight
Hemoglobin estimation analyzes the color intensity of light passing through your fingertip to estimate blood hemoglobin concentration. Low hemoglobin indicates anemia.
Peripheral Perfusion Index (Palm)
Wellness insight
Peripheral perfusion index via palm measures blood flow strength in the palm’s capillary network. Reduced perfusion can indicate Raynaud’s disease, PAD, or diabetic complications.
Nail Bed Anemia Screening
Wellness insight
Nail bed anemia screening analyzes fingernail bed color, pale nail beds are one of the most reliable physical signs of anemia. A wellness cue, not a blood test.
Blood Perfusion Map
Wellness insight
Blood perfusion shows how well blood is flowing to different areas of your face.
Capillary Refill Time
Wellness insight
Capillary refill time measures how quickly blood returns to your nail bed after pressing, normal is under 2 seconds. Prolonged refill suggests poor circulation or dehydration.
Blood Glucose Trend (Emerging)
Emerging research
Blood glucose trend tracks relative changes in blood sugar by analyzing subtle optical properties of blood flow. Detects trends (rising, stable, falling) rather than absolute values. An emerging estimate, not a glucose meter or diagnosis.
Palmar Erythema Detection
Emerging research
Palmar erythema detection identifies abnormal palm redness indicating liver disease, pregnancy, thyroid conditions, or rheumatoid arthritis.
Heart Rate Variability
The tiny timing shifts between beats that reveal how recovered and adaptable you are.
SDNN
Clinically studied
SDNN measures the overall variation in the time between your heartbeats, a key indicator of heart health.
RMSSD
Clinically studied
RMSSD measures short-term changes in your heartbeat timing and reflects how well your body can relax and recover.
pNN50
Clinically studied
pNN50 tells you what percentage of heartbeat intervals differ from each other by more than 50 milliseconds.
SDSD
Clinically studied
SDSD measures the variation in the differences between consecutive heartbeats, similar to RMSSD. It reflects your body’s ability to shift between activity and relaxation.
Mean NN Interval
Clinically studied
Mean NN interval is the average time between your heartbeats, measured in milliseconds. A longer interval means a slower, often healthier resting heart rate.
LF Power (0.04-0.15 Hz)
Clinically studied
LF power reflects a mix of your sympathetic (“fight or flight”) and parasympathetic (“rest and digest”) nervous system activity. Elevated LF power can indicate stress or tension.
HF Power (0.15-0.40 Hz)
Clinically studied
HF power reflects the activity of your parasympathetic nervous system, the part that helps you relax and recover.
Total Power
Clinically studied
Total power is the sum of all heart rate variability frequencies, it’s an overall measure of how adaptable your heart is.
LF/HF Ratio
Clinically studied
LF/HF ratio compares your stress (“fight or flight”) and relaxation (“rest and digest”) nervous system activity.
SD1 (Poincare)
Wellness insight
SD1 measures beat-to-beat (short-term) variation in your heart rhythm using a Poincare plot analysis.
SD2 (Poincare)
Wellness insight
SD2 measures longer-term patterns in your heart rhythm variation. It reflects the combined influence of both branches of your nervous system on your heart.
VLF Power (0.003-0.04 Hz)
Wellness insight
VLF power reflects very slow rhythms in your heartbeat, linked to hormonal regulation, temperature control, and long-term stress patterns.
Triangular Index
Wellness insight
Triangular index is another way to measure your overall heart rate variability using the shape of your heartbeat interval distribution.
Approximate Entropy (ApEn)
Emerging research
Approximate entropy measures how complex and unpredictable your heart rhythm is.
Sample Entropy (SampEn)
Emerging research
Sample entropy is a refined measure of how unpredictable your heartbeat patterns are.
DFA Alpha-1
Emerging research
DFA Alpha-1 measures the fractal-like patterns in your heartbeat over short periods.
Breathing & Oxygen
Respiration and oxygen signals, no finger clip or mask.
Breathing Rate Variability
Wellness insight
Tracks how much your breath timing shifts from one breath to the next.
Tidal Volume Estimate
Wellness insight
Approximates how much air you move with each normal breath.
Inspiratory Capacity Estimate
Wellness insight
Estimates the largest breath you could comfortably draw in.
Breath Pattern Regularity
Wellness insight
Assesses whether your breathing is smooth and steady or irregular.
Cardiovascular & Vascular
Blood pressure, vessel health and the signals behind long term heart risk.
Pulse Irregularity Index
Clinically studied
Pulse irregularity index measures how irregular the spacing between your heartbeats is. Some variation is completely normal and healthy.
Atrial Fibrillation Probability
Wellness insight
Atrial fibrillation probability estimates the likelihood that your heart rhythm shows signs of AFib, an irregular heartbeat. A low probability is normal and expected. An educational estimate, not a diagnosis.
AFib Risk Category
Wellness insight
AFib risk category classifies your estimated risk of atrial fibrillation, from low to high. Most people fall in the low category. An educational estimate, not a diagnosis.
Vascular Age
Wellness insight
Vascular age estimates the age of your blood vessels based on their stiffness and function, which can differ from your actual age.
10-Year CVD Risk Score
Wellness insight
10-year CVD risk score estimates your percentage chance of experiencing a cardiovascular event (like a heart attack or stroke) in the next 10 years. An educational estimate. Not a diagnosis.
IBI Entropy
Wellness insight
IBI entropy measures the randomness in the intervals between your heartbeats. A moderate level of entropy is healthy, it means your heart is responsive to your body’s needs.
Augmentation Index (AIx)
Wellness insight
Augmentation index measures how much the reflected pressure wave from your arteries adds to the peak blood pressure.
Poincare SD1/SD2 Ratio
Wellness insight
SD1/SD2 ratio compares short-term and long-term heart rhythm variation to show how balanced your nervous system is.
PAC Frequency Estimate
Emerging research
PAC frequency estimates how often premature atrial contractions (extra early heartbeats from the upper heart) occur. Occasional PACs are very common and usually harmless.
PVC Frequency Estimate
Emerging research
PVC frequency estimates how often premature ventricular contractions (extra beats from the lower heart) occur. Like PACs, occasional PVCs are common and usually harmless.
Pulse Wave Velocity (PWV)
Emerging research
Pulse wave velocity measures how fast blood pressure waves travel through your arteries. Faster waves usually mean stiffer arteries, which is a risk factor for heart disease.
Reflection Index
Emerging research
Reflection index measures how strongly pressure waves bounce back from the smaller blood vessels in your body.
Stiffness Index (SI)
Emerging research
Stiffness index provides an overall assessment of how stiff your large arteries are.
Heart Attack Risk Estimate
Emerging research
Estimates your relative risk of a heart attack based on your cardiovascular markers. A lower level is ideal. An educational estimate, not a diagnosis or prediction.
Stroke Risk Estimate
Emerging research
Estimates your relative risk of a stroke based on your cardiovascular indicators. An educational estimate, not a diagnosis or prediction.
Cardiac Output Estimate
Emerging research
Cardiac output estimates how much blood your heart pumps per minute. A healthy resting cardiac output is typically 4-8 liters per minute.
Stroke Volume Estimate
Emerging research
Stroke volume estimates how much blood your heart pumps with each individual beat. A healthy stroke volume is typically 60-100 mL per beat.
Venous SpO2 (SvO2)
Emerging research
Venous oxygen saturation (SvO2) estimates the oxygen level in your blood as it returns to the heart after delivering oxygen to your body. Normal values are around 60-80%.
Stress & Nervous System
How activated or recovered your autonomic nervous system is right now.
Baevsky Stress Index
Clinically studied
Baevsky stress index is a well-established measure of how much physiological stress your body is under, based on your heart rhythm patterns.
Composite Stress Score
Clinically studied
Composite stress score combines multiple heart rhythm and nervous system signals into a single stress rating. It gives a more complete picture than any single marker alone.
Stress Level Category
Clinically studied
Stress level category places your overall stress into a simple category, from low to very high, based on your physiological signals.
SNS Activity Index
Wellness insight
SNS activity index measures how active your sympathetic nervous system is, the “fight or flight” branch that revs you up.
PNS Activity Index
Wellness insight
PNS activity index measures how active your parasympathetic nervous system is, the “rest and digest” branch that helps you recover.
ANS Balance Index
Wellness insight
ANS balance index shows whether your autonomic nervous system is tilted toward stress (sympathetic) or recovery (parasympathetic).
Respiratory Sinus Arrhythmia (RSA)
Wellness insight
Respiratory sinus arrhythmia (RSA) measures a natural, healthy phenomenon where your heart rate speeds up slightly when you inhale and slows down when you exhale.
Baroreflex Sensitivity (BRS)
Emerging research
Baroreflex sensitivity measures how quickly your body adjusts your heart rate in response to blood pressure changes, like when you stand up suddenly.
Acute vs Chronic Stress Classification
Emerging research
Acute vs chronic stress classification tells you whether your body’s stress signals look like a temporary (acute) response or a longer-term (chronic) pattern.
Facial Tension Score
Emerging research
Facial tension score measures visible muscle tension in your face, which is a surprisingly reliable indicator of overall stress.
Metabolic & Body
Body composition and metabolic signals estimated from your face and body.
Body Mass Index
Clinically studied
Your weight to height ratio, a common general measure of weight status.
Body Fat Percentage Estimate
Clinically studied
Estimates the share of your body made up of fat tissue.
Basal Metabolic Rate
Clinically studied
Approximates the calories your body burns at complete rest.
Visceral Fat Index
Clinically studied
Estimates deep belly fat around your organs, the type most tied to metabolic risk.
Lean Body Mass Estimate
Clinically studied
Approximates the weight of everything in your body that is not fat.
Muscle Mass Estimate
Clinically studied
Estimates how much of your body is muscle.
Waist-Hip Ratio Estimate
Clinically studied
Estimates how your body distributes fat, a cardiovascular risk cue.
Body Water Estimate
Clinically studied
Approximates the proportion of your body made up of water.
Body Form Score
Clinically studied
A general read on your overall body composition and shape.
Obesity Degree Index
Clinically studied
Places your body composition on a simple weight status scale.
Hemoglobin Estimate
Emerging research
Hemoglobin estimate gives an approximation of your hemoglobin level, the protein in red blood cells that carries oxygen.
HbA1c Risk Estimate
Emerging research
HbA1c risk estimate approximates your average blood sugar levels over the past 2-3 months. An emerging estimate, not a diagnosis.
Blood Glucose Estimate
Emerging research
Blood glucose estimate approximates your current blood sugar level. Normal fasting glucose is 70-100 mg/dL. An emerging estimate, not a glucose meter or diagnosis.
Glucose Risk Category
Emerging research
Glucose risk category classifies your estimated blood sugar levels into a risk level, from normal to high risk. An emerging estimate, not a diagnosis.
Total Cholesterol Risk
Emerging research
Total cholesterol risk estimates whether your cholesterol levels may be putting you at elevated cardiovascular risk. Healthy total cholesterol is generally under 200 mg/dL. An emerging estimate, not a lab panel.
Triglyceride Risk
Emerging research
Triglyceride risk estimates whether your triglyceride levels, a type of fat in your blood, may be elevated. Normal triglycerides are under 150 mg/dL. An emerging estimate, not a lab panel.
LDL/HDL Risk Ratio
Emerging research
LDL/HDL Risk Ratio compares your “bad” cholesterol to your “good” cholesterol, giving a snapshot of your heart disease risk. An emerging estimate, not a lab panel.
Metabolic Syndrome Probability
Emerging research
Estimates your likelihood of a cluster of conditions: high blood sugar, excess belly fat, abnormal cholesterol, and high blood pressure. An emerging estimate, not a diagnosis.
Anemia Risk Flag
Emerging research
Anemia risk flag checks for signs that your blood may not be carrying enough oxygen, often due to low iron or other nutrient deficiencies. A wellness cue, not a diagnosis.
Hydration Index
Emerging research
Hydration index estimates how well-hydrated your body is based on subtle skin and facial cues. Even mild dehydration can cause headaches, brain fog, and fatigue before you feel thirsty.
Fitness & Recovery
Where your aerobic fitness sits and whether today is a training or rest day.
Resting HR Fitness Classification
Clinically studied
Resting HR fitness classification rates your resting heart rate against established fitness benchmarks. A lower resting heart rate generally means a stronger, more efficient heart.
VO2max Estimate
Wellness insight
VO2max estimate measures your body’s maximum ability to use oxygen during exercise, it’s one of the best indicators of overall cardiovascular fitness.
Cardiac Fitness Age
Wellness insight
Cardiac fitness age tells you how old your heart “acts” compared to your actual age. If your cardiac age is higher than your real age, your heart may be working harder than it should.
Recovery Score
Wellness insight
Recovery score reflects how well your body has bounced back from recent physical or mental stress. A low score suggests your body is still working hard to repair and recharge.
Training Readiness
Wellness insight
Training readiness indicates whether your body is primed for a hard workout or would benefit from a lighter day. If this score is low, pushing hard could increase your injury risk.
HRV Fitness Percentile
Wellness insight
HRV fitness percentile shows where your heart rate variability ranks compared to others your age. Higher HRV means your nervous system is flexible and resilient.
Respiratory Efficiency
Emerging research
Respiratory efficiency measures how effectively your lungs exchange oxygen and carbon dioxide with each breath. Good efficiency means your body gets more oxygen with less effort.
HR Recovery Estimate
Emerging research
HR recovery estimate predicts how quickly your heart rate drops after exercise, a key sign of cardiovascular health.
Aging & Longevity
How old your body reads physiologically, which can differ from your age.
Biological Age Estimate
Wellness insight
Biological age estimate is an overall estimate of how old your body appears to be, regardless of your birthday.
Apparent Facial Age
Wellness insight
Apparent facial age is how old you look based on your facial features alone, wrinkles, skin tone, and structural cues.
Vascular Age (detailed)
Wellness insight
Vascular age estimates the age of your blood vessels based on stiffness and circulation indicators.
HRV Age
Wellness insight
HRV age estimates how old your nervous system “acts” based on heart rate variability patterns. A younger HRV age suggests your body handles stress well and recovers efficiently.
Skin Health Age
Wellness insight
Skin health age evaluates the condition of your skin, texture, elasticity, tone, and clarity, and translates it into an age estimate.
Age Gap Score
Wellness insight
Age gap score shows the difference between your biological age and your actual age. A negative gap (biological age lower than real age) is great news.
Aging Rate / Pace
Emerging research
Aging rate / pace tracks whether you’re aging faster or slower than one biological year per calendar year.
Longevity Risk Score
Emerging research
Longevity risk score estimates your overall risk profile for age-related health decline based on multiple biomarkers combined. A higher score means more risk factors are present.
Mental & Cognitive
Fatigue, focus, mood and voice cues drawn from your face and sound.
Fatigue Score (PERCLOS)
Clinically studied
Fatigue score (PERCLOS) measures the percentage of time your eyes are partially or fully closed, a well-studied indicator of fatigue.
Drowsiness Level
Clinically studied
Drowsiness level detects how close you are to falling asleep based on eye and facial behavior. Even mild drowsiness can significantly impair your reaction time and judgment.
Blink Rate
Clinically studied
Blink rate counts how many times you blink per minute. Normal is about 15-20 blinks/min. A very low rate often occurs during intense screen use and can lead to dry eyes.
Blink Duration
Clinically studied
Blink duration measures how long each blink lasts. Normal blinks take about 100-400 milliseconds. Longer-than-normal blinks are a strong sign of drowsiness and fatigue.
Yawn Frequency
Clinically studied
Yawn frequency tracks how often you yawn, which is a natural response to fatigue, boredom, or the need for more oxygen.
Microsleep Detection
Clinically studied
Microsleep detection watches for very brief episodes (1-15 seconds) where your brain momentarily disengages, essentially falling asleep without realizing it.
Pupillary Light Reflex (PLR) Speed
Clinically studied
Pupillary light reflex speed measures how quickly your pupils constrict when exposed to bright light.
Pupil Constriction Amplitude
Clinically studied
Pupil constriction amplitude is how much your pupil shrinks when exposed to light, typically 1-3mm in healthy adults.
Respiratory Waveform Visualization
Clinically studied
Respiratory waveform visualization amplifies subtle chest and shoulder movements from breathing, providing rate, depth, regularity, and effort measurements comparable to standard monitors.
Consensual Pupil Response
Wellness insight
Consensual pupil response checks whether both pupils react when light is shone in just one eye.
Vocal Tremor Detection
Wellness insight
Vocal tremor detection analyzes micro-tremors in your voice that are imperceptible to the ear but detectable by signal processing.
Tremor Detection & Characterization
Wellness insight
Tremor detection and characterization uses Eulerian video magnification to amplify invisible motions by 10-100x.
Anxiety Level
Wellness insight
A wellness estimate of your current anxiety. Never a diagnosis.
Depression Screening Score
Wellness insight
A directional wellness estimate loosely modeled on mood questionnaires. Not a diagnosis.
Attention Level
Wellness insight
Attention level estimates how focused and engaged you are based on eye movement, gaze direction, and facial cues.
Eye Redness Score
Wellness insight
Eye redness score measures the degree of redness visible in the whites of your eyes. Mild redness can come from dryness, allergies, screen time, or lack of sleep.
Pupil Dilation Latency
Wellness insight
Pupil dilation latency measures how long it takes your pupil to return to its resting (dilated) size after light exposure ends. Normal re-dilation takes 5-10 seconds.
Stress Level (Voice Biomarkers)
Wellness insight
Stress level via voice analyzes vocal biomarkers that change under stress, pitch variation, jitter, and shimmer.
Emotional Valence Score
Wellness insight
Estimates whether your current expression leans positive or negative.
Stress-Resilience Index
Wellness insight
A directional read on how well you appear to be coping with stress.
Motivation Index
Wellness insight
Gauges your apparent drive and energy from facial and physiological cues.
Mindfulness Readiness
Wellness insight
Estimates how settled and present you seem right now.
Sleep Quality Proxy
Wellness insight
An indirect read on recent sleep quality from your recovery signals.
Social Connection Index
Wellness insight
A directional wellness cue about mood and engagement.
Life Satisfaction Score
Wellness insight
A broad, directional wellbeing estimate. Not a clinical measure.
Consciousness Level Composite
Wellness insight
A composite alertness and presence score from your scan.
Autonomic Pupil Score
Emerging research
Autonomic pupil score combines pupil constriction, dilation latency, and oscillation patterns into a single score reflecting overall autonomic nervous system health.
Concussion Screening Score
Emerging research
Concussion screening score evaluates multiple pupillary metrics simultaneously. A wellness score, not a concussion or TBI diagnosis.
Depression Screening (Voice Prosody)
Emerging research
Depression screening via voice analyzes prosody, rhythm, tone, and variation in speech. Depression typically flattens vocal range, reduces speaking rate, and increases pause duration. A directional wellness estimate, not a diagnosis.
Cognitive Decline Indicator (Speech)
Emerging research
Cognitive decline indicator tracks speech fluency, word-finding pauses, and semantic patterns that may change with early cognitive decline. A wellness cue, not a cognitive diagnosis.
Parkinson’s Voice Biomarker
Emerging research
Parkinson’s voice biomarker combines vocal tremor, breathiness, monotone pitch, imprecise articulation, and reduced volume into a composite score. A wellness signal, not a screen or diagnosis.
Carotid Pulse Visualization
Emerging research
Carotid pulse visualization amplifies skin movement over the carotid artery to visualize the arterial pulse waveform, revealing information about aortic valve function and arterial.
Emotional Valence
Emerging research
Emotional valence measures whether your current emotional state leans positive (happy, content) or negative (sad, upset). It’s captured from subtle facial expressions.
Emotional Arousal
Emerging research
Emotional arousal measures how activated or calm your emotional state is right now, independent of whether you’re feeling good or bad.
Emotion Category
Emerging research
Emotion category identifies your most likely current emotion from your facial expressions, such as happy, sad, angry, fearful, surprised, or neutral.
Affect Variability
Emerging research
Affect variability measures how much your emotional expressions fluctuate over the course of a scan. Some variability is completely normal.
Depression Risk Score (PHQ-9 Proxy)
Emerging research
Depression risk score screens for potential signs of depression using facial and behavioral cues. A directional wellness estimate, not a diagnosis.
Anxiety Risk Score (GAD-7 Proxy)
Emerging research
Anxiety risk score estimates your anxiety level using facial tension and behavioral signals. A directional wellness estimate, not a diagnosis.
Mental Wellness Score
Emerging research
Mental wellness score gives you a combined snapshot of your emotional and psychological well-being based on multiple behavioral indicators.
Cognitive Load Level
Emerging research
Cognitive load level estimates how hard your brain is working right now based on eye movement, blink patterns, and facial tension.
Psychomotor Activity Score
Emerging research
Psychomotor activity score measures the speed and amount of your facial movements and micro-expressions.
Cognitive Load Index (Pupillometry)
Emerging research
Cognitive load index uses pupil dilation as a window into mental effort.
Pain Response Index (Pupillometry)
Emerging research
Pain response index uses pupil dilation patterns to objectively estimate pain levels. Acute pain causes measurable pupil dilation through sympathetic activation.
Respiratory Health Assessment (Voice)
Emerging research
Respiratory health assessment detects vocal characteristics associated with respiratory conditions.
Micro-Expression Analysis
Emerging research
Micro-expression analysis amplifies facial muscle movements too subtle for the human eye. These involuntary micro-expressions reveal emotional states, stress responses, and pain.
Neonatal Vital Signs (Motion)
Emerging research
Neonatal vital signs monitoring uses motion amplification to detect breathing and heart rate in newborns without skin contact.
Skin & Facial
A dermatology style read on tone, texture and signs of aging.
Skin Luminance Score
Wellness insight
Skin luminance score rates the overall brightness and glow of your skin. Healthy, well-hydrated skin naturally reflects light evenly.
Sun Damage / Photoaging Grade
Wellness insight
Sun damage / photoaging grade rates the visible effects of cumulative sun exposure on your skin, including dark spots, uneven tone, and fine lines.
Skin Texture Score
Wellness insight
Skin texture score evaluates the smoothness and evenness of your skin’s surface.
Anemia Screening (Spectral)
Wellness insight
Anemia screening via spectral analysis performs deeper RGB channel spectroscopy on facial skin. A wellness cue, not a blood test.
Jaundice / Bilirubin Signal
Wellness insight
Analyzes yellow discoloration in skin and sclera using calibrated RGB spectroscopy. A wellness cue to see a professional, not a diagnosis.
Melanin Index
Wellness insight
Melanin index measures the amount of melanin pigment in your skin, which determines your skin tone and how your skin responds to sun exposure.
Erythema Index
Wellness insight
Erythema index measures skin redness, which can result from inflammation, sun exposure, irritation, or increased blood flow.
Acne Severity Score
Wellness insight
Acne severity score rates the extent and intensity of acne visible on your face, from mild to severe.
Rosacea Signal
Wellness insight
Looks for signs of rosacea, a common condition causing persistent redness, visible blood vessels, and sometimes small bumps on the face. A wellness cue, not a diagnosis.
Pigmentation Uniformity
Wellness insight
Pigmentation uniformity measures how even your skin tone is across your face.
Wrinkle Depth Map
Wellness insight
Wrinkle depth map provides a detailed view of wrinkle depth across different areas of your face.
Tongue Sublingual Veins
Emerging research
Examines the veins under your tongue, which can reflect circulation.
Capillary Refill Time
Emerging research
Times how quickly color returns to your nail after pressing, a circulation cue.
Eczema/Psoriasis Flag
Emerging research
Eczema/psoriasis flag checks for skin patterns consistent with eczema or psoriasis, conditions that cause red, itchy, flaky, or scaly patches. A wellness cue to see a professional, not a diagnosis.
Skin Mark Check
Emerging research
Flags a skin spot or mark worth showing a dermatologist. A wellness cue, not a cancer screen or diagnosis.
Pore Visibility Score
Emerging research
Pore visibility score rates how noticeable your pores are. Pore size is largely genetic, but excess oil, sun damage, and aging can make them more prominent.
Dehydration Assessment
Emerging research
Dehydration assessment combines spectral indicators, skin turgor, color temperature shifts, and blood concentration changes, to estimate hydration status.
Bruise Age Estimation
Emerging research
Bruise age estimation tracks color change of bruises as hemoglobin breaks down: red/purple (fresh) to green (5-7 days) to yellow/brown (7-14 days).
Tongue Color Index
Emerging research
Analyzes the color of your tongue, a traditional cue to circulation and general health.
Tongue Coating Thickness
Emerging research
Estimates the coating on your tongue, which can shift with digestion and hydration.
Tongue Body Shape
Emerging research
Assesses the shape and swelling of your tongue as a wellness cue.
Tongue Moisture Index
Emerging research
Gauges how moist or dry your tongue looks, a simple hydration signal.
Digestive Health Score (tongue)
Emerging research
A directional digestive wellness score read from your tongue’s appearance.
Organ Imbalance Pattern (tongue)
Emerging research
Flags general wellness patterns some traditions associate with tongue appearance.
Heat/Cold Constitution (tongue)
Emerging research
A traditional wellness read of your constitution from tongue signs.
Nail Bed Color Index
Emerging research
Analyzes the color of your nail beds, where paleness can hint at anemia.
Nail Surface Texture
Emerging research
Assesses ridges and smoothness of your nails as a nutrition and health cue.
Lunula Visibility Score
Emerging research
Measures the visible half moon at the base of your nails.
Nail Brittleness Index
Emerging research
Estimates how brittle your nails appear, which can relate to nutrition.
Nutritional Deficiency Pattern (nail)
Emerging research
Looks for nail signs sometimes linked to vitamin or mineral gaps.
Eyes & Vision
Ocular signals that reflect neurological and general health.
Under-Eye Bags Index
Wellness insight
Measures puffiness beneath your eyes, which can reflect sleep, hydration and fluid balance.
Eye Wrinkle Depth
Wellness insight
Estimates the depth of fine lines around your eyes as a sign of skin aging.
Dark Circle Intensity
Wellness insight
Rates the darkness under your eyes, often linked to sleep, fatigue and circulation.
Periorbital Edema
Wellness insight
Detects swelling around the eyes that can point to fluid retention or allergies.
Eye Sagging Index
Wellness insight
Assesses drooping of the skin around the eyes associated with aging.
Eye Cell Vitality
Wellness insight
A directional read on the freshness and tone of the skin around your eyes.
Lymphatic Obstruction Index
Wellness insight
Looks for signs of poor lymphatic drainage around the eyes, such as persistent puffiness.
Clinical Screening
Directional screening flags that suggest when to see a professional.
Jaundice / Bilirubin Flag
Emerging research
Checks for a yellowish tint in the whites of your eyes or skin. A wellness cue to see a professional, not a diagnosis.
Facial Asymmetry Score
Emerging research
Monitors for unevenness in your face, such as one side drooping. A wellness cue, not a stroke screen or diagnosis.
Parkinson Hypomimia Score
Emerging research
Parkinson hypomimia score screens for reduced facial expressiveness (sometimes called “masked face”), which some research associates with Parkinson’s. A wellness cue, not a diagnosis.
Tremor Detection Flag
Emerging research
Tremor detection flag watches for involuntary shaking or trembling in your facial muscles.
Exophthalmos Flag (Thyroid)
Emerging research
Exophthalmos flag checks for unusual forward bulging of the eyes, which can be associated with thyroid conditions, particularly an overactive thyroid (Graves’ disease). A wellness cue, not a thyroid diagnosis.
Pain Level Indicator (FACS)
Emerging research
Pain level indicator estimates your current pain level by analyzing subtle facial muscle movements.
Anemia Screening (Conjunctival)
Emerging research
Anemia screening (conjunctival) examines the inner lining of your lower eyelid for paleness, which is a classic sign of low red blood cell count. A wellness cue, not a blood test or diagnosis.
BMI Estimate (Facial)
Emerging research
BMI estimate provides a rough body mass index estimate based on facial proportions. This is an approximation, facial structure varies greatly between individuals.
Waist-to-Height Ratio Estimate
Emerging research
Waist-to-height ratio estimate approximates your body fat distribution. Carrying excess weight around the midsection is linked to higher risks for heart disease and diabetes.
Sleep Apnea Risk Estimate
Emerging research
Estimates your likelihood of obstructive sleep apnea, a condition where breathing repeatedly stops during sleep. An emerging estimate, not a diagnosis.